5- Major Brick Wall
5- Major Brick Wall
Objectives:
- Address the Problem
- Find a Solution
- Begin Implementing Solution
In his talk, which has become known as The Last Lecture, Randy Pausch discusses the many challenges a person faces in their life as they attempt to achieve their goals. He calls them "brick walls" and says that they are there to help you figure out how to get around them.
We have hit a major brick wall.
I am intentionally making this post uninteresting so that you skip it and go to the next post, which will solve the problems outlined in this post.
Address the Problem
The next step in our NiFi flow is to process the data we are getting from GetTwitter. We know that it is providing us with a JSON file, which is great, but it is raw data. This JSON file, unprocessed, is practically useless to us. It provides us with WAY too much information, and some of the files that we are outputting are not even real tweets.
Boiled down, the problem is that we have data, but it doesn't look nice.
Find a Solution
I have looked for several solutions to this problem. First, I believed that it might be best try converting the JSON into something like a CSV so that it could be brought into R or parsed in a piece of software that we could write that parses "flat" text files. This would work out great, if NiFi had a simple solution for converting JSON to CSV, which it currently does not. My attempts to make this a reality using various processors fell flat on its face and was way too complex for the problem at hand.Next, I looked into pushing the data out of NiFi in a format that JSON could convert to... like SQL. While it's not native to NiFi, converting JSON to an SQL statement is something I have done in the past. This task would require a target SQL database, which while possible to set up, would be time consuming and need to be explained on here.
As far as the front end of the data visualization would go, I dreamed of building a high quality UI for the task, but my interest in Tableau lead me to want explore this application as a tool for achieving that same goal.
Once opening Tableau and playing around for a little bit, I managed to connect it up to the folder that I pushed the Twitter Output to and oh my goodness look at that, no need for a database. We will be using Tableau as the endpoint for our data.
Setting Up Tableau.
Tableau is a proprietary software, I am new to it, this will be a big learning experience for all... I will be using this for 14 days, starting today... I'm not even positive that this will work.
Please find the link to the download of Tableau here:
Please find the link to the download of Tableau here:
https://www.tableau.com/products/trial
When asked about a business, I put John Carroll University information into it.
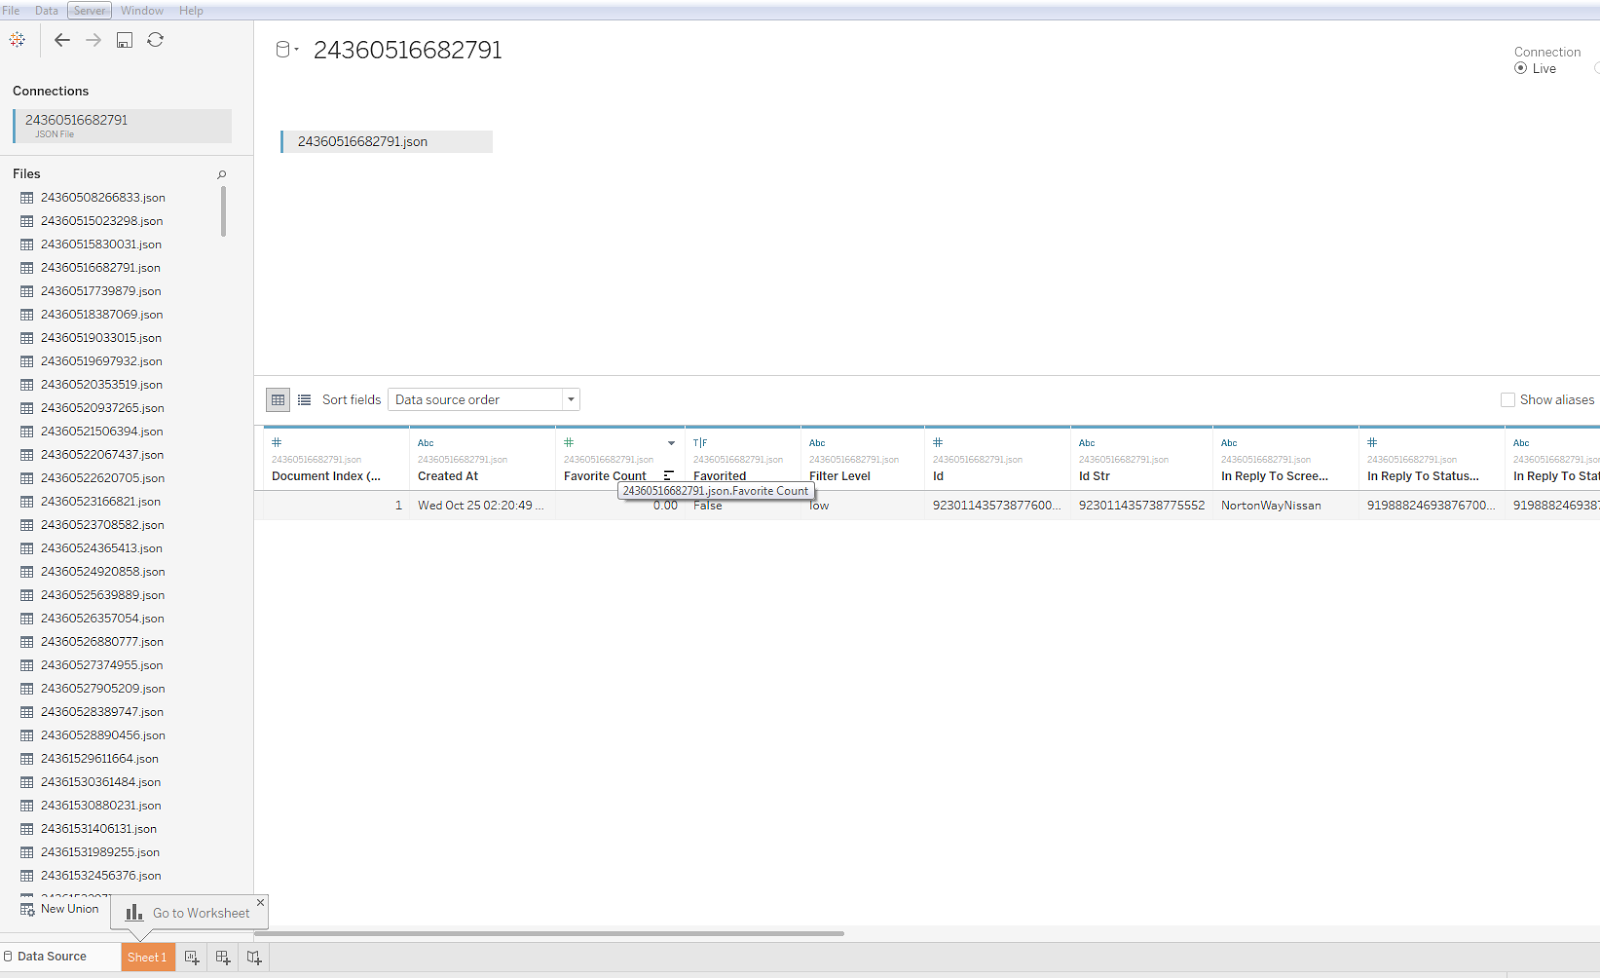
In Tableau add a new JSON data source to your new project. Choose a file in your folder with the Twitter Output... hopefully it looks like this:
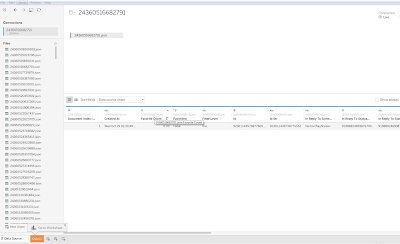
So next time we will try to figure out what the hell Tableau does and how to use it for this project.
When asked about a business, I put John Carroll University information into it.
In Tableau add a new JSON data source to your new project. Choose a file in your folder with the Twitter Output... hopefully it looks like this:
So next time we will try to figure out what the hell Tableau does and how to use it for this project.
Next Time:
I'm sorry that I had to make this post... I hope you didn't make it this far and just moved onto the next post...
Thanks for reading this blog post!
Take it easy, Dude.


This blog is really going downhill.
ReplyDeleteThis comment has been removed by the author.
ReplyDeleteI appreciate your endeavor to use Tableau, which can often be difficult to work with, to visualize data. God speed!
ReplyDelete